


Denmark data shows very wide COVID vaccine adverse impacts
Sometimes a figure or graph tells an important story

Below is the key figure recently published that tells a disturbing story of how Pfizer vaccines vary as lots produce very different adverse healh impacts.
The “how bad is my batch” data have long demonstrated that there is remarkable variability in the toxicity (adverse event profile) of different batches (or “Lots”) of the various SARS-CoV-2 mRNA vaccines. This has often lead to speculation that some of the deployed batches were actually placebos, and others (presumably the toxic ones) were active vaccine. This theory of the case posits a level of nefarious collusion between the vaccine manufacturers and the federal government which would be ethically and legally stunning if true.
Here are excerpts from the article: Batch-dependent safety of the BNT162b2 mRNA COVID-19 vaccine.
Vaccination has been widely implemented for mitigation of coronavirus disease-2019 (Covid-19), and by 11 November 2022, 701 million doses of the BNT162b2 mRNA vaccine (Pfizer-BioNTech) had been administered and linked with 971,021 reports of suspected adverse effects (SAEs) in the European Union/European Economic Area (EU/EEA).1 Vaccine vials with individual doses are supplied in batches with stringent quality control to ensure batch and dose uniformity.2 Clinical data on individual vaccine batch levels have not been reported and batch-dependent variation in the clinical efficacy and safety of authorized vaccines would appear to be highly unlikely. However, not least in view of the emergency use market authorization and rapid implementation of large-scale vaccination programs, the possibility of batch-dependent variation appears worthy of investigation. We therefore examined rates of SAEs between different BNT162b2 vaccine batches administered in Denmark (population 5.8 million) from 27 December 2020 to 11 January 2022.
A total of 10,793,766 doses were administered to 4,026,575 persons with the use of 52 different BNT162b2 vaccine batches (2340–814,320 doses per batch) and 43,496 SAEs were registered in 13,635 persons, equaling 3.19 ± 0.03 (mean ± SEM) SAEs per person. [Correction added on 09 June 2023, after first online publication: The total number of doses and patient counts were corrected in the preceding statement]. In each person, individual SAEs were associated with vaccine doses from 1.531 ± 0.004 batches resulting in a total of 66,587 SAEs distributed between the 52 batches. Batch labels were incompletely registered or missing for 7.11% of SAEs, leaving 61,847 batch-identifiable SAEs for further analysis of which 14,509 (23.5%) were classified as severe SAEs and 579 (0.9%) were SAE-related deaths. Unexpectedly, rates of SAEs per 1000 doses varied considerably between vaccine batches with 2.32 (0.09–3.59) (median [interquartile range]) SAEs per 1000 doses, and significant heterogeneity (p < .0001) was observed in the relationship between numbers of SAEs per 1000 doses and numbers of doses in the individual batches. Three predominant trendlines were discerned, with noticeable lower SAE rates in larger vaccine batches and additional batch-dependent heterogeneity in the distribution of SAE seriousness between the batches representing the three trendlines (Figure 1). Compared to the rates of all SAEs, serious SAEs and SAE-related deaths per 1.000 doses were much less frequent and numbers of these SAEs per 1000 doses displayed considerably greater variability between batches, with lesser separation between the three trendlines (not shown).
The observed variation in SAE rates and seriousness between BTN162b2 vaccine batches in this nationwide study was contrary to the expected homogenous rate and distribution of SAEs between batches.
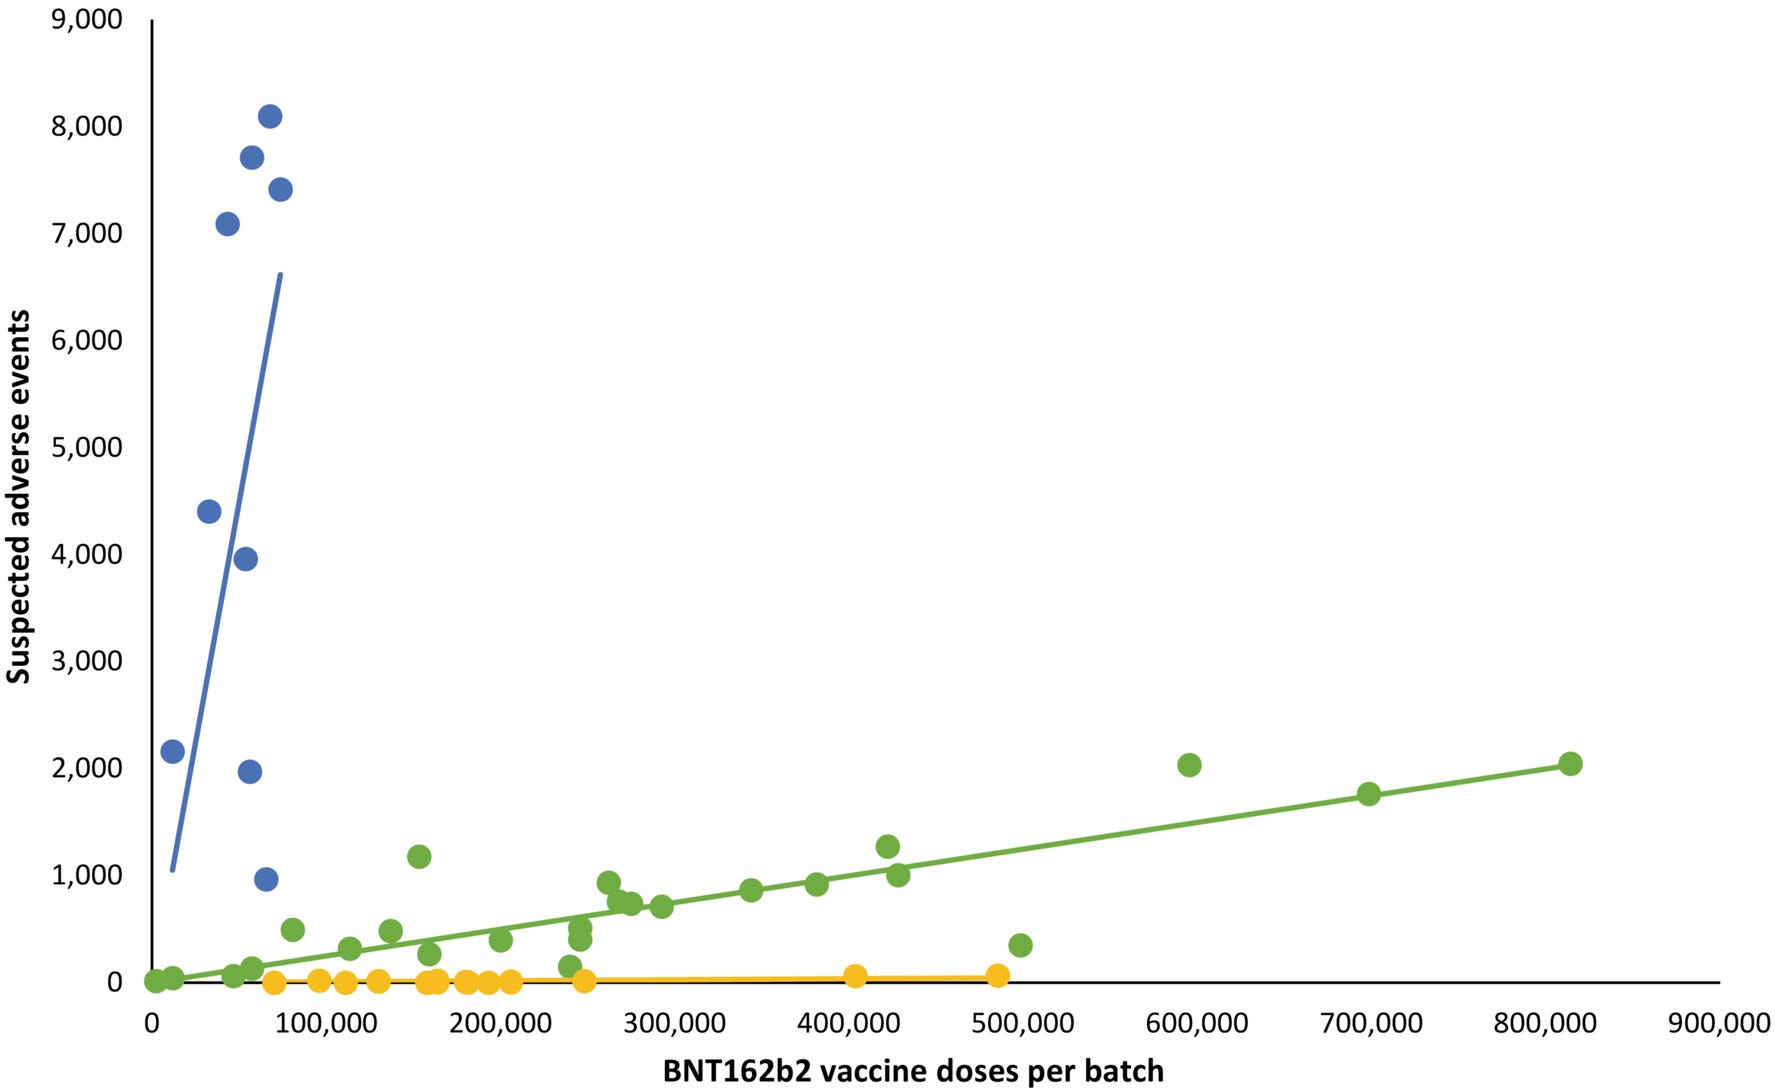
Numbers of suspected adverse events (SAEs) after BNT612b2 mRNA vaccination in Denmark (27 December 2020–11 January 2022) according to the number of doses per vaccine batch. Each dot represents a single vaccine batch. Trendlines are linear regression lines. Blue: R2 = 0.78, β = 0.0898 (95% confidence interval [CI] 0.0514–0.1281), green: R2 = 0.89, β = 0.0025 (95% CI 0.0021–0.0029), yellow: R2 = 0.68, β = 0.000087 (95% CI 0.000056–0.000118). Vaccine batches representing the blue, green and yellow trendlines comprised 4.22%, 63.69% and 32.09% of all vaccine doses, respectively, with 70.78%, 27.49% and 47.15% (blue trendline), 28.84%, 71.50% and 51.99% (green trendline), and 0.38%, 1.01%, and 0.86% (yellow trendline) of all SAEs, serious SAEs, and SAE-related deaths, respectively.
Amazing data everyone should be aware of.